Expertise Provided by Mark Robertson
If you're exploring the manufacturing industry it's important to look beyond numbers when assessing a company health. Ratios such as inventory turnover and debt to equity act as indicators that provide valuable insights into a company’s debt management, efficient asset utilization and profit generation. However, it is crucial to understand these ratios within their context. Factors like industry benchmarks, year over year trends and the company’s unique strategy help paint a picture of its standing. Don't stop there! Advanced ratios like DuPont analysis can offer deeper insights while qualitative factors such as management strength and brand reputation complete the puzzle. Remember that ratios are tools but should be used wisely. Combine them with expert guidance and a holistic view for making informed investment decisions, in the changing world of manufacturing.
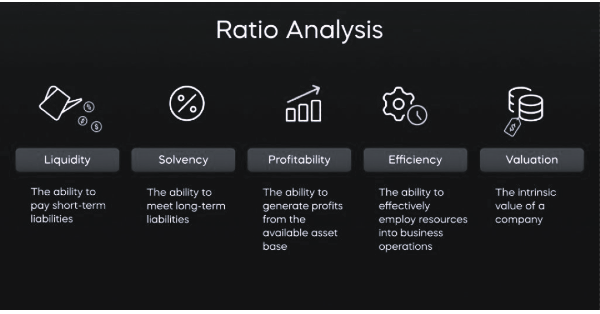
Current Ratio
The current ratio measures how well a company can pay off its short-term debts using its short-term assets. For manufacturing companies, a desirable current ratio falls within the range of 1.2 to 2.0. This implies that the company possesses assets to cover its current liabilities, between 1.2 and 2 times over. A higher current ratio is generally viewed favorably as it suggests that the company is more likely to fulfill its short-term obligations. However, a high current ratio may indicate inefficiency, in utilizing assets.
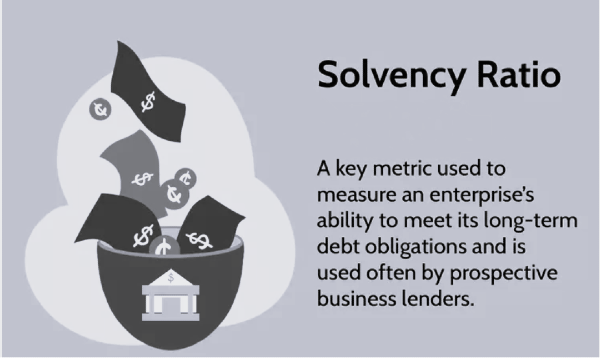
Solvency Ratio
The solvency ratio is an indicator of a company’s well-being, in the long term. It is computed by dividing the assets of the company by its liabilities. Generally, a manufacturing company should aim for a solvency ratio of 2.0 or greater which signifies that it possesses assets to cover its liabilities over. On the hand a lower solvency ratio may suggest that the company is vulnerable, to difficulties.
 Source: Investopedia
Inventory Turnover Ratio
The inventory turnover ratio provides insight, into how a company sells its inventory. It is determined by dividing the cost of goods sold by the inventory. For a manufacturing company a desirable inventory turnover ratio is usually 5.0 or higher. This indicates that the company sells its inventory five times in a year. Conversely a lower inventory turnover ratio suggests that the company might not be selling its inventory enough leading to tied up cash and potential harm to profitability.
Asset Turn Ratio
The asset turnover ratio provides insights, into how a company utilizes its assets to generate sales. To calculate this ratio you divide the company’s sales by its assets. In the case of manufacturing companies, an asset turnover ratio would typically be 0.5 or higher. This signifies that the company generates $0.50 or more in sales, for every $1.00 of assets it possesses. Conversely a lower asset turnover ratio might indicate use of assets, potentially impacting profitability negatively.
Quick Ratio
The quick ratio is a metric that assesses how well a company can settle its obligations using its readily available resources. To calculate the ratio, you divide the company’s assets (excluding inventory) by its current liabilities. In general, a manufacturing company should aim for a ratio of 1.0 or higher. This indicates that the company possesses assets to cover its current liabilities without relying on inventory sales. Conversely a quick ratio might suggest that the company could face challenges, in meeting term financial responsibilities.
Net Profit Margin
There are ways to gauge the success of a manufacturing company but one widely used measure is the net profit margin. To calculate the profit margin, you divide the company’s income by its net sales. Ideally a manufacturing company should have a profit margin of 5.0% or more. In terms this indicates that for every dollar of sales the company is making a profit of 5 cents or more. On the hand if the net profit margin is lower it suggests that the company isn't very profitable.
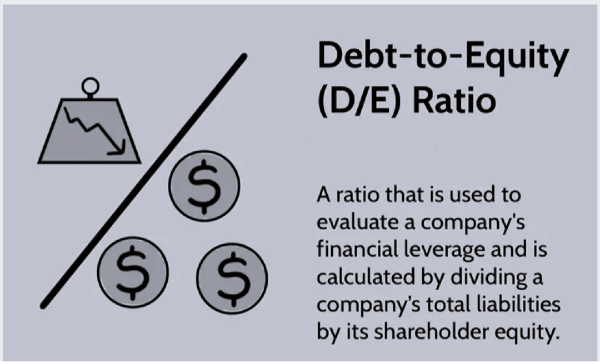
Equity Ratio
The equity ratio provides an indication of the proportion of a company’s funding that comes from its owners’ equity. It can be computed by dividing the shareholders equity by the assets of the company. In manufacturing companies, it is generally considered favorable to have an equity ratio of 40%. This signifies that 40% or more of the company’s assets are being financed by its owners. Conversely a lower equity ratio suggests a reliance, on debt financing, which can potentially raise the company’s vulnerability to difficulties.
Debt-to-Equity Ratio also explain the how much of the business is financed by owner capital and how much from debt financing.
 Source: Investopedia
Debt to Asset Ratio
The debt-to-asset ratio serves as a gauge to determine the extent to which a company relies on debt for financing. It is computed by dividing the company’s liabilities by its assets. In the case of a manufacturing company, a debt to asset ratio would typically be 1.0 or lower. This implies that the company’s debt is either equal to or less than its assets. Conversely if the debt, to asset ratio is higher it suggests that the company depends heavily on borrowing thereby increasing its vulnerability to troubles.
Net Profit Ratio
The net profit ratio that is considered ideal for a manufacturing company can vary depending on factors such, as the industry and the size of the company. However, it is generally considered good if a manufacturing company achieves a profit ratio of 5.0% or higher.
Gross Profit Margin
A manufacturing company usually aims for a profit margin of at least 20% or more. To calculate the profit margin, you divide the company’s profit by its net sales. The gross profit margin shows how much of the sales revenue remains after deducting the cost of goods sold. A higher gross profit margin indicates that the company can generate profits from its sales.
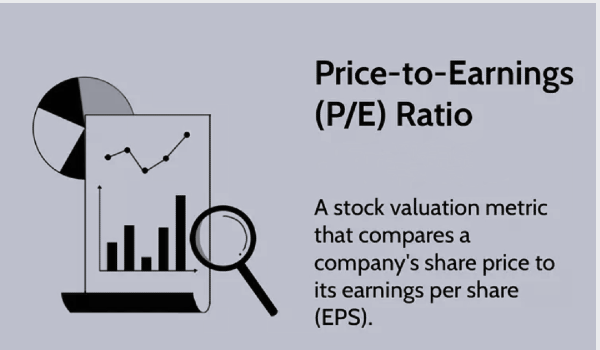
Price to Earnings Ratio
 Source: Investopedia
The Price-to-Earnings Ratio (P/E Ratio) is a used metric to assess companies especially in the manufacturing industry. It measures the relationship between a company’s stock price and its earnings, per share (EPS) giving an insight into how much investors willing to invest for each dollar of the company’s earnings.
Calculating the P/E Ratio:
P/E Ratio = Current Share Price / Earnings per Share (EPS)
Interpreting the P/E Ratio:
Higher P/E: Generally, indicates that investors expect higher future growth potential, but could also signal overvaluation.
Lower P/E: Might suggest the company is undervalued or has lower growth prospects, but could also point to underlying issues.
Industry Benchmarks:
When we compare the price, to earnings (P/E) ratio of a company to the ratio in its industry it gives us an understanding of the situation. It's important to note that a higher P/E ratio, for a tech company that is experiencing growth might be considered reasonable whereas if a traditional manufacturing company has a
ratio it could raise some concerns.
Limitations of P/E Ratio:
Doesn't consider debt: A company with high debt could have a lower P/E ratio despite higher risk.
Ignores future growth: P/E is based on past earnings, neglecting potential future growth.
Sensitive to accounting practices: Different accounting methods can impact EPS and, consequently, the P/E ratio.
Additional Considerations:
Forward P/E: Estimates future earnings, potentially offering a more forward-looking perspective.
PEG Ratio: Adjusts P/E for expected earnings growth, providing a more comprehensive valuation tool.
P/E Ratio and Manufacturing Sector:
- Manufacturing companies typically have lower P/E ratios compared to high-growth sectors like technology.
- Consider industry benchmarks and growth prospects when interpreting P/E ratios for manufacturing companies.
- Combine P/E with other financial ratios and qualitative factors for a holistic evaluation.
Using P/E Ratio for Investment Decisions:
While the P/E ratio provides insights, it should not be the factor considered when making investment decisions. It is important to combine it with analysis tools, industry knowledge and your own risk tolerance to make informed choices.
By comprehending the P/E ratio recognizing its limitations and understanding how it applies to the manufacturing sector you can develop a comprehension of company valuations. Make more informed decisions regarding investments.
In the section we explored important financial ratios that are utilized in analyzing manufacturing companies. While it is crucial to understand these ratios, it is equally important to go beyond their definitions and delve deeper in order to gain more nuanced insights.
Let's continue this journey by dissecting some crucial aspects of these ratios and their practical application in evaluating companies:
Industry Benchmarks and Context:
Financial ratios fall on a spectrum. Their importance differs depending on industry standards. To gain an understanding it's more meaningful to compare a company’s ratios to those of its competitors or the industry average. For example, in a capital sector, like heavy machinery manufacturing, a quick ratio of 0.8 might be considered acceptable. However, the same ratio could raise concerns, for a consumer goods company that operates at a pace. Industry reports and financial databases often offer benchmarks to each industry for ratios.
Trend Analysis and Year-over-Year Comparisons:
It is important to analyze trends over a period of time. If the inventory turnover ratio increases, over years it could suggest improved efficiency. On the hand a decreasing current ratio may indicate liquidity problems. By comparing ratios from year, to year we can identify negative trends and pinpoint areas that may need attention.
Impact of Business Model and Strategy:
Financial ratios should be understood within the framework of a company’s business model and strategic approach. In the case of a growing company that is making investments, in new facilities a relatively high debt to equity ratio could be deemed acceptable. On the hand a established company, with stable operations may require a lower ratio to ensure long term financial stability and sustainability.
Beyond Ratios: Additional Considerations:
Financial ratios provide insights. It’s important to remember that they shouldn't be the only factor when making decisions. Other qualitative factors, like the strength of management, brand reputation and market dynamics also play a role. Additionally, it's crucial to take into account the following;
Seasonality: Certain ratios can fluctuate depending on trends within the industry.
Accounting Policies: Differences in accounting methods can impact how ratios are calculated. It's necessary to make careful adjustments for accurate comparisons.
Capital Structure: Companies with different financing strategies naturally have varying debt, to equity ratios.
Advanced Ratio Analysis:
For deeper analysis, consider utilizing more advanced ratios:
DuPont Analysis: Decomposes return on equity (ROE) into profit margin, asset turnover, and financial leverage, providing insights into how each component contributes to overall profitability.
Operating Cash Flow Ratio: Evaluates a company's ability to generate cash from its core operations, independent of accounting depreciation.
Free Cash Flow: Represents the cash available for dividends, debt repayment, or share buybacks after accounting for all operational and investment expenses.
Leveraging Ratios for Investment Decisions:
Understanding ratios gives investors the power to make informed choices when it comes to manufacturing companies. By analyzing these ratios in context taking industry benchmarks into account and considering factors you can confidently evaluate a company’s financial well-being, profitability and risk profile.
It's important to note that financial analysis is an undertaking and relying solely on ratios can sometimes be misleading. It's advisable to seek advice and combine analysis, with qualitative factors in order to make sound investment decisions.
By digging into ratios instead of just scratching the surface you can gain valuable insights into the overall health and future prospects of manufacturing companies. This will ultimately enable you to make investment decisions based on a foundation of knowledge.
Read more about Industrial Stocks in our ongoing sector series:
The Top Industrial Stocks
Are Industrials a Good Investment?
The Best Industrial ETFs
How do you Evaluate Industrial Stocks?
What is the Manufacturing Sector
Industrial Stocks with Dividends
Why Invest in Manufacturing Stocks
Important Manufacturing Sector Ratios
Why are Industrial Stocks Doing Well
What Affects the Industrial Industry?


Expertise Provided by Mark Robertson
If you're exploring the manufacturing industry it's important to look beyond numbers when assessing a company health. Ratios such as inventory turnover and debt to equity act as indicators that provide valuable insights into a company’s debt management, efficient asset utilization and profit generation. However, it is crucial to understand these ratios within their context. Factors like industry benchmarks, year over year trends and the company’s unique strategy help paint a picture of its standing. Don't stop there! Advanced ratios like DuPont analysis can offer deeper insights while qualitative factors such as management strength and brand reputation complete the puzzle. Remember that ratios are tools but should be used wisely. Combine them with expert guidance and a holistic view for making informed investment decisions, in the changing world of manufacturing.
Current Ratio
The current ratio measures how well a company can pay off its short-term debts using its short-term assets. For manufacturing companies, a desirable current ratio falls within the range of 1.2 to 2.0. This implies that the company possesses assets to cover its current liabilities, between 1.2 and 2 times over. A higher current ratio is generally viewed favorably as it suggests that the company is more likely to fulfill its short-term obligations. However, a high current ratio may indicate inefficiency, in utilizing assets.
Solvency Ratio
The solvency ratio is an indicator of a company’s well-being, in the long term. It is computed by dividing the assets of the company by its liabilities. Generally, a manufacturing company should aim for a solvency ratio of 2.0 or greater which signifies that it possesses assets to cover its liabilities over. On the hand a lower solvency ratio may suggest that the company is vulnerable, to difficulties.
Inventory Turnover Ratio
The inventory turnover ratio provides insight, into how a company sells its inventory. It is determined by dividing the cost of goods sold by the inventory. For a manufacturing company a desirable inventory turnover ratio is usually 5.0 or higher. This indicates that the company sells its inventory five times in a year. Conversely a lower inventory turnover ratio suggests that the company might not be selling its inventory enough leading to tied up cash and potential harm to profitability.
Asset Turn Ratio
The asset turnover ratio provides insights, into how a company utilizes its assets to generate sales. To calculate this ratio you divide the company’s sales by its assets. In the case of manufacturing companies, an asset turnover ratio would typically be 0.5 or higher. This signifies that the company generates $0.50 or more in sales, for every $1.00 of assets it possesses. Conversely a lower asset turnover ratio might indicate use of assets, potentially impacting profitability negatively.
Quick Ratio
The quick ratio is a metric that assesses how well a company can settle its obligations using its readily available resources. To calculate the ratio, you divide the company’s assets (excluding inventory) by its current liabilities. In general, a manufacturing company should aim for a ratio of 1.0 or higher. This indicates that the company possesses assets to cover its current liabilities without relying on inventory sales. Conversely a quick ratio might suggest that the company could face challenges, in meeting term financial responsibilities.
Net Profit Margin
There are ways to gauge the success of a manufacturing company but one widely used measure is the net profit margin. To calculate the profit margin, you divide the company’s income by its net sales. Ideally a manufacturing company should have a profit margin of 5.0% or more. In terms this indicates that for every dollar of sales the company is making a profit of 5 cents or more. On the hand if the net profit margin is lower it suggests that the company isn't very profitable.
Equity Ratio
The equity ratio provides an indication of the proportion of a company’s funding that comes from its owners’ equity. It can be computed by dividing the shareholders equity by the assets of the company. In manufacturing companies, it is generally considered favorable to have an equity ratio of 40%. This signifies that 40% or more of the company’s assets are being financed by its owners. Conversely a lower equity ratio suggests a reliance, on debt financing, which can potentially raise the company’s vulnerability to difficulties. Debt-to-Equity Ratio also explain the how much of the business is financed by owner capital and how much from debt financing.
Debt to Asset Ratio
The debt-to-asset ratio serves as a gauge to determine the extent to which a company relies on debt for financing. It is computed by dividing the company’s liabilities by its assets. In the case of a manufacturing company, a debt to asset ratio would typically be 1.0 or lower. This implies that the company’s debt is either equal to or less than its assets. Conversely if the debt, to asset ratio is higher it suggests that the company depends heavily on borrowing thereby increasing its vulnerability to troubles.
Net Profit Ratio
The net profit ratio that is considered ideal for a manufacturing company can vary depending on factors such, as the industry and the size of the company. However, it is generally considered good if a manufacturing company achieves a profit ratio of 5.0% or higher.
Gross Profit Margin
A manufacturing company usually aims for a profit margin of at least 20% or more. To calculate the profit margin, you divide the company’s profit by its net sales. The gross profit margin shows how much of the sales revenue remains after deducting the cost of goods sold. A higher gross profit margin indicates that the company can generate profits from its sales.
Price to Earnings Ratio
The Price-to-Earnings Ratio (P/E Ratio) is a used metric to assess companies especially in the manufacturing industry. It measures the relationship between a company’s stock price and its earnings, per share (EPS) giving an insight into how much investors willing to invest for each dollar of the company’s earnings.
Calculating the P/E Ratio:
P/E Ratio = Current Share Price / Earnings per Share (EPS)
Interpreting the P/E Ratio:
Higher P/E: Generally, indicates that investors expect higher future growth potential, but could also signal overvaluation. Lower P/E: Might suggest the company is undervalued or has lower growth prospects, but could also point to underlying issues.
Industry Benchmarks:
When we compare the price, to earnings (P/E) ratio of a company to the ratio in its industry it gives us an understanding of the situation. It's important to note that a higher P/E ratio, for a tech company that is experiencing growth might be considered reasonable whereas if a traditional manufacturing company has a ratio it could raise some concerns.
Limitations of P/E Ratio:
Doesn't consider debt: A company with high debt could have a lower P/E ratio despite higher risk. Ignores future growth: P/E is based on past earnings, neglecting potential future growth. Sensitive to accounting practices: Different accounting methods can impact EPS and, consequently, the P/E ratio.
Additional Considerations:
Forward P/E: Estimates future earnings, potentially offering a more forward-looking perspective. PEG Ratio: Adjusts P/E for expected earnings growth, providing a more comprehensive valuation tool.
P/E Ratio and Manufacturing Sector:
Using P/E Ratio for Investment Decisions:
While the P/E ratio provides insights, it should not be the factor considered when making investment decisions. It is important to combine it with analysis tools, industry knowledge and your own risk tolerance to make informed choices.
By comprehending the P/E ratio recognizing its limitations and understanding how it applies to the manufacturing sector you can develop a comprehension of company valuations. Make more informed decisions regarding investments.
In the section we explored important financial ratios that are utilized in analyzing manufacturing companies. While it is crucial to understand these ratios, it is equally important to go beyond their definitions and delve deeper in order to gain more nuanced insights.
Let's continue this journey by dissecting some crucial aspects of these ratios and their practical application in evaluating companies:
Industry Benchmarks and Context:
Financial ratios fall on a spectrum. Their importance differs depending on industry standards. To gain an understanding it's more meaningful to compare a company’s ratios to those of its competitors or the industry average. For example, in a capital sector, like heavy machinery manufacturing, a quick ratio of 0.8 might be considered acceptable. However, the same ratio could raise concerns, for a consumer goods company that operates at a pace. Industry reports and financial databases often offer benchmarks to each industry for ratios.
Trend Analysis and Year-over-Year Comparisons:
It is important to analyze trends over a period of time. If the inventory turnover ratio increases, over years it could suggest improved efficiency. On the hand a decreasing current ratio may indicate liquidity problems. By comparing ratios from year, to year we can identify negative trends and pinpoint areas that may need attention.
Impact of Business Model and Strategy:
Financial ratios should be understood within the framework of a company’s business model and strategic approach. In the case of a growing company that is making investments, in new facilities a relatively high debt to equity ratio could be deemed acceptable. On the hand a established company, with stable operations may require a lower ratio to ensure long term financial stability and sustainability.
Beyond Ratios: Additional Considerations:
Financial ratios provide insights. It’s important to remember that they shouldn't be the only factor when making decisions. Other qualitative factors, like the strength of management, brand reputation and market dynamics also play a role. Additionally, it's crucial to take into account the following;
Seasonality: Certain ratios can fluctuate depending on trends within the industry. Accounting Policies: Differences in accounting methods can impact how ratios are calculated. It's necessary to make careful adjustments for accurate comparisons. Capital Structure: Companies with different financing strategies naturally have varying debt, to equity ratios.
Advanced Ratio Analysis:
For deeper analysis, consider utilizing more advanced ratios: DuPont Analysis: Decomposes return on equity (ROE) into profit margin, asset turnover, and financial leverage, providing insights into how each component contributes to overall profitability. Operating Cash Flow Ratio: Evaluates a company's ability to generate cash from its core operations, independent of accounting depreciation. Free Cash Flow: Represents the cash available for dividends, debt repayment, or share buybacks after accounting for all operational and investment expenses.
Leveraging Ratios for Investment Decisions:
Understanding ratios gives investors the power to make informed choices when it comes to manufacturing companies. By analyzing these ratios in context taking industry benchmarks into account and considering factors you can confidently evaluate a company’s financial well-being, profitability and risk profile.
It's important to note that financial analysis is an undertaking and relying solely on ratios can sometimes be misleading. It's advisable to seek advice and combine analysis, with qualitative factors in order to make sound investment decisions.
By digging into ratios instead of just scratching the surface you can gain valuable insights into the overall health and future prospects of manufacturing companies. This will ultimately enable you to make investment decisions based on a foundation of knowledge.
Read more about Industrial Stocks in our ongoing sector series:
The Top Industrial Stocks
Are Industrials a Good Investment?
The Best Industrial ETFs
How do you Evaluate Industrial Stocks?
What is the Manufacturing Sector
Industrial Stocks with Dividends
Why Invest in Manufacturing Stocks
Important Manufacturing Sector Ratios
Why are Industrial Stocks Doing Well
What Affects the Industrial Industry?