How to Time the Market with Positioning
You can’t time the market! Many have tried, and many have failed.
But there is an acceptable way for investors to time the market: what about positioning assets rather than predicting the future?
As the saying goes: time in the market is better than timing the market.
What does that mean? It means you miss the big up days if you pull yourself out during the big down days.
As the other saying goes, volatility clusters. Volatility, while always around, happens to the upside and the downside around the same periods.
You cannot miss these big up days! But you need those big up days: you recently had big down days!
And that is the difficulty with timing the market; you need to be right twice: both when you sell and when you buy. You know better than to time the market. No one is right twice. Not all the time.
So why not use positioning instead?
Positioning is Like Market Timing
What if you position your investments to take advantage of market volatility rather than trying to predict the future?
Positioning vs. predicting means guessing if the market will be up or down.
Positioning means deciding ahead of time on asset allocation and rebalancing strategy.
Positioning is Asset Allocation and Rebalancing
If you have bonds in your portfolio, then you can rebalance and sell them while they are up to buy stocks when they are down. That’s right! You just rebalance your position rather than predict the market. No foul!
Of course, you can’t be 100% equities to take advantage of positioning your investments.
But you don’t want to be 100% equities anyway.
Why Don’t I Want to Be 100% Equities?
Even if you are young and have time to take advantage of rebalancing during a downturn in the market, you want to have at least 10% bonds in your portfolio.
After all, a 100/0 equity-to-bond ratio is about as good as a 90/10.
Wait, no one has told you that before? Well, take a look at the efficient frontier.
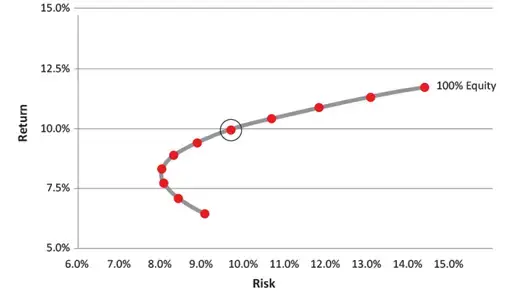
Above, you can see the efficient frontier. Returns are on the vertical, and risk (as measured by standard deviation) is on the bottom. The efficient frontier is the set of portfolios that offers the highest expected return per unit risk. Reward due to the risk you take given your asset allocation.
The top right dot is a 100/0 portfolio with the highest risk and the highest return.
But look at how shallow the slope is when you go down to 90/10, 80/20, etc.
You take less risk as you drop down your asset allocation, but the reward is not much different. My point: 100/0 is not much different than 90/10.
Once you get down to the 60/40 portfolio (the circled dot), then back up two more to 40/60. Here, the curve takes an unusual turn: more bonds increase the risk AND lower the return. So portfolios with more bonds than 30/70 have more risk and less returns. Who knew?
Go, efficient frontier! Of course, it is not that simple, as the efficient frontier changes depending on the actual returns and volatility during a given period. Let’s check that out now.
Positioning vs. Predicting over the Decades
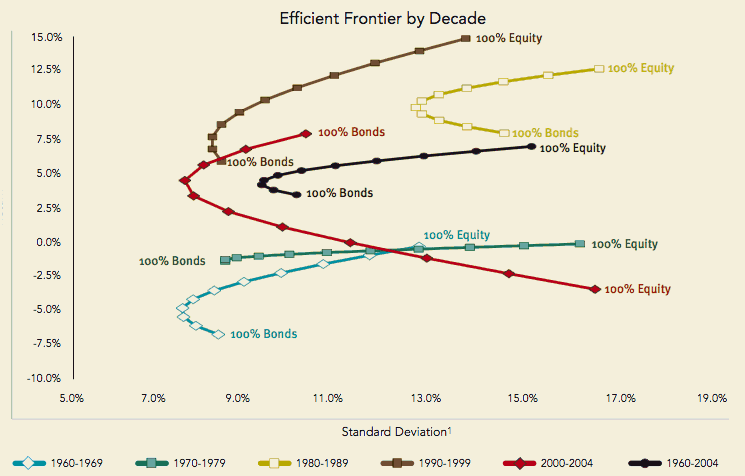 Above, you can see the curve looks different for different decades. Spend a little time looking at this graph, but let me point out that the 60s (light blue) had a pretty normal looking efficient frontier. The ’70s, on the other hand (in green), had flat returns regardless of asset allocation.
Next, in red, look at 2000-2004. Look closely! During that period, bonds are actually on the top (where you would expect to see stocks), and you got less return and more volatility for 100% stocks!
Finally, in black, see the average from 1960 to 2004.
These are inflation-adjusted (real) returns and make several important points. But I want to make the point that 100/0 is not much different than 90/10 or 80/20.
Rebalancing: When You Have Bonds, You Can Time the Market
Or rather than time the market, you can rebalance your position when it gets out of whack.
Remember, the goal is not to predict the future. If you could do that, you’d be rich and not bother with blogs on the internet. But no one can do that despite knowing that every year there is usually a 10% drop in the market, and every 5-7 years a drop of 20% plus. These are the times when the impatient transfer their money to the patient.
Positioning vs. predicting. You want to have bonds to use positioning to time the market via rebalancing.
When to rebalance? Do it when the market is high to control your risk and return to your preferred asset allocation. And do it when the market tanks to sell high (bonds) and buy low (stocks). Vanguard has an amazing white paper on the topic.
Remember, concentration makes you rich, and diversification keeps you rich.
Risk-adjusted returns are more important after you have saved up some money. Sure, initially, go 100% stocks. But, once you have “enough,” take some risk off the table and invest per your preferred asset allocation.
Be a positioner if you don’t want to be accused of being a market timer. Set your asset allocation and rebalance.
Many folks want to avoid bonds right now. So while I hope you see there is value in bonds, you may consider a slice of your asset allocation devoted to bond-alternatives.












How to Time the Market with Positioning
You can’t time the market! Many have tried, and many have failed.
But there is an acceptable way for investors to time the market: what about positioning assets rather than predicting the future?
As the saying goes: time in the market is better than timing the market.
What does that mean? It means you miss the big up days if you pull yourself out during the big down days.
As the other saying goes, volatility clusters. Volatility, while always around, happens to the upside and the downside around the same periods.
You cannot miss these big up days! But you need those big up days: you recently had big down days!
And that is the difficulty with timing the market; you need to be right twice: both when you sell and when you buy. You know better than to time the market. No one is right twice. Not all the time.
So why not use positioning instead?
Positioning is Like Market Timing
What if you position your investments to take advantage of market volatility rather than trying to predict the future?
Positioning vs. predicting means guessing if the market will be up or down.
Positioning means deciding ahead of time on asset allocation and rebalancing strategy.
Positioning is Asset Allocation and Rebalancing
If you have bonds in your portfolio, then you can rebalance and sell them while they are up to buy stocks when they are down. That’s right! You just rebalance your position rather than predict the market. No foul!
Of course, you can’t be 100% equities to take advantage of positioning your investments.
But you don’t want to be 100% equities anyway.
Why Don’t I Want to Be 100% Equities?
Even if you are young and have time to take advantage of rebalancing during a downturn in the market, you want to have at least 10% bonds in your portfolio.
After all, a 100/0 equity-to-bond ratio is about as good as a 90/10.
Wait, no one has told you that before? Well, take a look at the efficient frontier.
Above, you can see the efficient frontier. Returns are on the vertical, and risk (as measured by standard deviation) is on the bottom. The efficient frontier is the set of portfolios that offers the highest expected return per unit risk. Reward due to the risk you take given your asset allocation.
The top right dot is a 100/0 portfolio with the highest risk and the highest return.
But look at how shallow the slope is when you go down to 90/10, 80/20, etc.
You take less risk as you drop down your asset allocation, but the reward is not much different. My point: 100/0 is not much different than 90/10.
Once you get down to the 60/40 portfolio (the circled dot), then back up two more to 40/60. Here, the curve takes an unusual turn: more bonds increase the risk AND lower the return. So portfolios with more bonds than 30/70 have more risk and less returns. Who knew?
Go, efficient frontier! Of course, it is not that simple, as the efficient frontier changes depending on the actual returns and volatility during a given period. Let’s check that out now.
Positioning vs. Predicting over the Decades
Next, in red, look at 2000-2004. Look closely! During that period, bonds are actually on the top (where you would expect to see stocks), and you got less return and more volatility for 100% stocks!
Finally, in black, see the average from 1960 to 2004.
These are inflation-adjusted (real) returns and make several important points. But I want to make the point that 100/0 is not much different than 90/10 or 80/20.
Rebalancing: When You Have Bonds, You Can Time the Market
Or rather than time the market, you can rebalance your position when it gets out of whack.
Remember, the goal is not to predict the future. If you could do that, you’d be rich and not bother with blogs on the internet. But no one can do that despite knowing that every year there is usually a 10% drop in the market, and every 5-7 years a drop of 20% plus. These are the times when the impatient transfer their money to the patient.
Positioning vs. predicting. You want to have bonds to use positioning to time the market via rebalancing.
When to rebalance? Do it when the market is high to control your risk and return to your preferred asset allocation. And do it when the market tanks to sell high (bonds) and buy low (stocks). Vanguard has an amazing white paper on the topic.
Remember, concentration makes you rich, and diversification keeps you rich.
Risk-adjusted returns are more important after you have saved up some money. Sure, initially, go 100% stocks. But, once you have “enough,” take some risk off the table and invest per your preferred asset allocation.
Be a positioner if you don’t want to be accused of being a market timer. Set your asset allocation and rebalance.
Many folks want to avoid bonds right now. So while I hope you see there is value in bonds, you may consider a slice of your asset allocation devoted to bond-alternatives.
Originally Posted in FiPhysician