Introduction
In an ever-evolving landscape of the stock market, traders are seeking reliable strategies to capture market trends and ultimately make profitable investment decisions. While a simple buy and hold strategy does tend to perform really well over the long term, you cannot catch any additional returns when the market goes down. Among the various technical indicators that are available nowadays, this article will focus on the simple moving averages (SMA) of a stock. The SMA is known for its simplicity and effectiveness.
The goal of this article to explore how short-term and long-term SMA’s can be used as a strategy and can generate trading signals in order to increase portfolio performance. In the following sections we will take a closer look at what a simple moving average is and how to we can create trading signals based on the SMA strategy. Finally, a case study of JP Morgan (JPM) is shown. JP Morgan is one of the largest banks in the US with over $3 trillion in assets under management. Furthermore, JPM is one of the largest banks in the world and considered to be crucial player in the financial stability board (FSB) where they monitor the global financial system. In the last few years, JPM stock has seen both upward and downward trends due to a changing market environment caused by Covid-19, rising interest rates, rising inflation, changing monetary policies etc. Using JPM in a case study shows the difference in returns if we would have bought and hold the stock until the end of the investment period versus the return we would have made if we implemented the SMA crossover strategy.
What is a simple moving average?
A simple moving average (SMA) is a technical indicator that smooths out the price data of a share over a specific time period. Therefore, the SMA is calculated by taking the average of a given set of values over a specific time period. For example, when we have a 10-day SMA this would imply that we take the last 10 observations of the price and calculate the average price for the last day. Usually traders use both a short-term and long-term SMA’s in order to find certain market trends as well as buy and sell signals. Noteworthy is that a trader receives a buy/sell signal when the short-term SMA crosses the long-term SMA. Because we are using two SMA curves, it is important that both have a different time period. Usually the short-term SMA has a time period between 7 and 50 days while the long-term SMA uses a larger time period between 150 and 200 days. This is crucial because if the time period of both SMA’s is very short, many trading signals occur where we have to switch positions too often and as a result, lose returns in the process.
Creating trading signals
Now it is time to get more specific with our SMA trading strategy. Explicitly, a short term and long term SMA is chosen and the crossover of both SMA’s will give us a trading signal to either go long or short in a stock dependent on the signal. A golden cross occurs when the short-term EMA crosses above the long-term SMA, suggesting a bullish market trend in which we take a long position in the stock. In contrast, a death cross occurs when the short term SMA drops below the long term SMA, indicating a bearish pattern. implying to take a short position in the stock.
Case study: Trading JP Morgan stock using the SMA strategy
In order to get a better understanding of the effectiveness on trading using SMA trading signals, a case study with respect to JP Morgan stock has been set up to compare a buy and hold strategy versus the SMA trading strategy. The first step is to identify the investment period which will start in 2020-01-01 until 2024-01-01. This is a very interesting investment period since there was a lot of systematic risk and uncertainty in the market. Some of the major events that happened in this time period is the covid-19 pandemic which had a negative effect on the stock market, a quantitative easing cycle with low inflation and low interest rates and after 2022 the market experienced more contraction due to hawkish monetary policies like increasing interest rates in order to fight rising inflation.
The next step to take is to identify the length of both our short and long-term SMA. For this research a short-term SMA of 50-days and a long-term SMA of 150-days is chosen. Note, that there might be better combinations of SMA’s that would result in larger returns. The difference in stock characteristics like volatility, volume growth vs value or large vs small cap stocks further plays a role in determining the length of the SMA’s. Hence, the length of the SMA’s are dependent on the stock you choose and the time period. Note, sometimes it is not ideal to optimize your strategy based on one time period as this might cause overfitting of the data. Implying that if we use the same SMA’s on a different time period, the strategy might perform worse.
Figure 1: The short and long term SMA’s and the trading signals
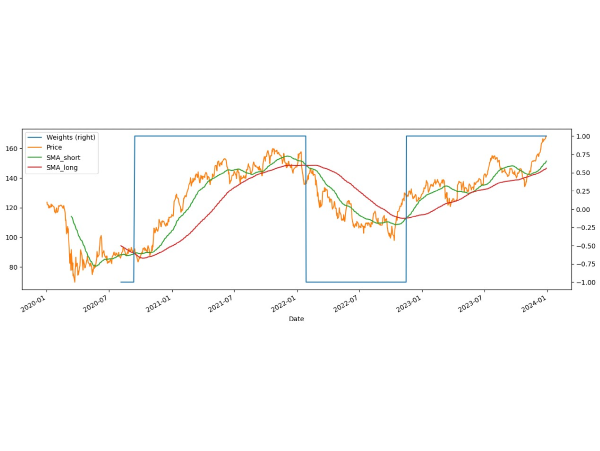
In figure 1 you can see the JP Morgan stock price, short SMA, long SMA and the trading signal depicted in blue. The first thing that jumps out is that JPM experienced both an upward and downward trend during the investment period. Next, when comparing the short and long SMA, it is clear to see that the short SMA remains closer to shareprice of JPM because of the fact that we use a smaller time window (50-days). In contrast, the long (200-day) SMA is further away from the price curve since we use more days to calculate the average. With respect to the trading signals, the weight graph indicates whether to go long or short. Specifically, when the graph equals 1, this means we take a long position in JPM and when the weight equals -1, we take a short position.
In this time period, there are 3 trading signals. In 2020-09 we start off by taking a short position for a small period of time but around 2020-10 we see our first trading signal indicating to go long. Therefore we switch from a short to a long position in JPM. This was a very accurate signal as the share price of JPM went up after the signal. We keep this long position during the upward trend until we see the second trading signal on 2022-02. At this moment the short SMA crosses below the long SMA indicating that we have to go short. Noteworthy is that this has been a very good signal since after that moment the price of JPM dropped. Hence, we are making money on our short position.
Finally, around 2022-11 we receive our final trading signal where the short SMA crosses above the long SMA again, implying we have to take a long position in JPM. This was a good signal as well since the price of JPM started rising again. Hence, the trading signals helped us determine the upward and downward trends of the stock during our investment period.
Figure 2: the equity curves of the SMA strategy versus buy and hold strategy
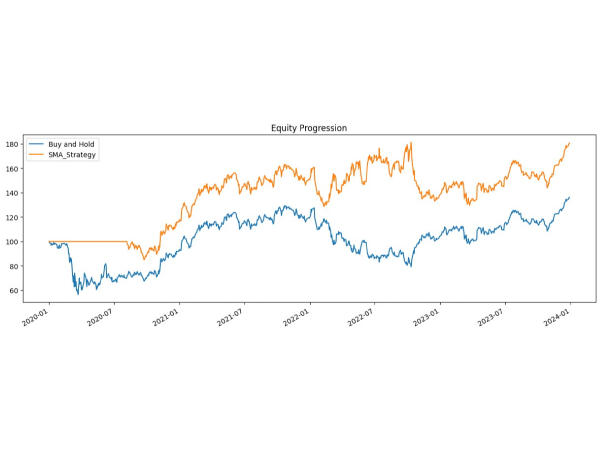
As we can see in figure 2, the simple moving average strategy significantly outperformed the buy and hold strategy for JPM. At the end of the investment period the SMA strategy has a total return of 80.39% while the buy and hold strategy only has a return of 36.05%. So what does the equity curve tell us? First of all, it is important to note that we don’t invest in the first 150 days for the SMA strategy since we need this data to construct our 150-day SMA. This was also the period where the Covid-19 pandemic struck and caused the buy and hold strategy to significantly decrease in value. Furthermore, from 2020-9 until 2022-02 we do see a very similar pattern in performance for both strategies due to the fact that both strategies have a long positions during this time. The divergence in portfolio performance mainly occurs during the period from 2022-02 until 2022-11. This is the moment where we short the JPM stock in the SMA strategy portfolio. As a result, the buy and hold strategy decreases in value because the share price decreases while the SMA strategy increases in value instead. From 2022-11 and onwards, both strategies have a long position and therefore follow a similar pattern again.
Hence, the SMA strategy performs the best thanks to its short position in 2022. But there are even more metrics that improve with our strategy. First, the Sharpe ratio improves which was 0.40 for the buy and hold and 0.74 for the SMA strategy. The Sharpe ratio measures the risk adjusted return of a stock. Ideally your ratio should be above one indicating that your earn excess return per unit of risk. While the Sharpe ratio is still below 1, an increase from 0.40 to 0.74 is still significant. Furthermore, the maximum downturn is also smaller for the SMA strategy. The maximum drawdown implies the drop from the peak of the portfolio to the bottom of the portfolio before you reach a new all time high. The max drawdown for the buy and hold strategy is -43.62% while for the SMA strategy it is only -28.53%. Indicating that the SMA strategy is less subjected to extreme losses.
Discussion
As the SMA strategy has shown, the performance is significantly better compared to the buy and hold strategy. However, it is important to discuss some of the practical aspects of trading on these signals. In this case study, the assumptions has been made that we do not pay any transactions fees and do not take into account the bid-ask spread. In reality, you have to take these factors into consideration as this will impact your costs and return. Hence, when you choose SMA’s with a shorter time period, this would imply more trading signals to act upon and therefore more transactions costs. Furthermore, market conditions also play a role when you have to select the time period for your SMA’s. When there is a lot of market uncertainty, it might be beneficial to choose shorter SMA’s to quickly react to rapid market changes and enter at more optimal trading points.
Conclusion
Trading JPM stock using the SMA crossover strategy can be a powerful strategy for those looking to capitalize on the up- and downward trends in a stock. Capturing downward trends would not be possible with a simple buy and hold strategy. Further, while the simplicity and effectiveness of SMA’s make them an appealing option for traders, it is important to consider them as part of a broader investment strategy. It is recommended to also look at other technical indicators and the fundamentals of a stock. Combining multiple strategies will help you make better price predictions and therefore, better investment decisions.
For investors that are eager to apply SMA strategies but have limited trading experience, it can be a good idea to start trading with a demo account as this will provide you with valuable practice without bearing any financial risk.
I/we have a position in an asset mentioned


Introduction
In an ever-evolving landscape of the stock market, traders are seeking reliable strategies to capture market trends and ultimately make profitable investment decisions. While a simple buy and hold strategy does tend to perform really well over the long term, you cannot catch any additional returns when the market goes down. Among the various technical indicators that are available nowadays, this article will focus on the simple moving averages (SMA) of a stock. The SMA is known for its simplicity and effectiveness.
The goal of this article to explore how short-term and long-term SMA’s can be used as a strategy and can generate trading signals in order to increase portfolio performance. In the following sections we will take a closer look at what a simple moving average is and how to we can create trading signals based on the SMA strategy. Finally, a case study of JP Morgan (JPM) is shown. JP Morgan is one of the largest banks in the US with over $3 trillion in assets under management. Furthermore, JPM is one of the largest banks in the world and considered to be crucial player in the financial stability board (FSB) where they monitor the global financial system. In the last few years, JPM stock has seen both upward and downward trends due to a changing market environment caused by Covid-19, rising interest rates, rising inflation, changing monetary policies etc. Using JPM in a case study shows the difference in returns if we would have bought and hold the stock until the end of the investment period versus the return we would have made if we implemented the SMA crossover strategy.
What is a simple moving average?
A simple moving average (SMA) is a technical indicator that smooths out the price data of a share over a specific time period. Therefore, the SMA is calculated by taking the average of a given set of values over a specific time period. For example, when we have a 10-day SMA this would imply that we take the last 10 observations of the price and calculate the average price for the last day. Usually traders use both a short-term and long-term SMA’s in order to find certain market trends as well as buy and sell signals. Noteworthy is that a trader receives a buy/sell signal when the short-term SMA crosses the long-term SMA. Because we are using two SMA curves, it is important that both have a different time period. Usually the short-term SMA has a time period between 7 and 50 days while the long-term SMA uses a larger time period between 150 and 200 days. This is crucial because if the time period of both SMA’s is very short, many trading signals occur where we have to switch positions too often and as a result, lose returns in the process.
Creating trading signals
Now it is time to get more specific with our SMA trading strategy. Explicitly, a short term and long term SMA is chosen and the crossover of both SMA’s will give us a trading signal to either go long or short in a stock dependent on the signal. A golden cross occurs when the short-term EMA crosses above the long-term SMA, suggesting a bullish market trend in which we take a long position in the stock. In contrast, a death cross occurs when the short term SMA drops below the long term SMA, indicating a bearish pattern. implying to take a short position in the stock.
Case study: Trading JP Morgan stock using the SMA strategy
In order to get a better understanding of the effectiveness on trading using SMA trading signals, a case study with respect to JP Morgan stock has been set up to compare a buy and hold strategy versus the SMA trading strategy. The first step is to identify the investment period which will start in 2020-01-01 until 2024-01-01. This is a very interesting investment period since there was a lot of systematic risk and uncertainty in the market. Some of the major events that happened in this time period is the covid-19 pandemic which had a negative effect on the stock market, a quantitative easing cycle with low inflation and low interest rates and after 2022 the market experienced more contraction due to hawkish monetary policies like increasing interest rates in order to fight rising inflation.
The next step to take is to identify the length of both our short and long-term SMA. For this research a short-term SMA of 50-days and a long-term SMA of 150-days is chosen. Note, that there might be better combinations of SMA’s that would result in larger returns. The difference in stock characteristics like volatility, volume growth vs value or large vs small cap stocks further plays a role in determining the length of the SMA’s. Hence, the length of the SMA’s are dependent on the stock you choose and the time period. Note, sometimes it is not ideal to optimize your strategy based on one time period as this might cause overfitting of the data. Implying that if we use the same SMA’s on a different time period, the strategy might perform worse.
Figure 1: The short and long term SMA’s and the trading signals
In figure 1 you can see the JP Morgan stock price, short SMA, long SMA and the trading signal depicted in blue. The first thing that jumps out is that JPM experienced both an upward and downward trend during the investment period. Next, when comparing the short and long SMA, it is clear to see that the short SMA remains closer to shareprice of JPM because of the fact that we use a smaller time window (50-days). In contrast, the long (200-day) SMA is further away from the price curve since we use more days to calculate the average. With respect to the trading signals, the weight graph indicates whether to go long or short. Specifically, when the graph equals 1, this means we take a long position in JPM and when the weight equals -1, we take a short position.
In this time period, there are 3 trading signals. In 2020-09 we start off by taking a short position for a small period of time but around 2020-10 we see our first trading signal indicating to go long. Therefore we switch from a short to a long position in JPM. This was a very accurate signal as the share price of JPM went up after the signal. We keep this long position during the upward trend until we see the second trading signal on 2022-02. At this moment the short SMA crosses below the long SMA indicating that we have to go short. Noteworthy is that this has been a very good signal since after that moment the price of JPM dropped. Hence, we are making money on our short position.
Finally, around 2022-11 we receive our final trading signal where the short SMA crosses above the long SMA again, implying we have to take a long position in JPM. This was a good signal as well since the price of JPM started rising again. Hence, the trading signals helped us determine the upward and downward trends of the stock during our investment period.
Figure 2: the equity curves of the SMA strategy versus buy and hold strategy
As we can see in figure 2, the simple moving average strategy significantly outperformed the buy and hold strategy for JPM. At the end of the investment period the SMA strategy has a total return of 80.39% while the buy and hold strategy only has a return of 36.05%. So what does the equity curve tell us? First of all, it is important to note that we don’t invest in the first 150 days for the SMA strategy since we need this data to construct our 150-day SMA. This was also the period where the Covid-19 pandemic struck and caused the buy and hold strategy to significantly decrease in value. Furthermore, from 2020-9 until 2022-02 we do see a very similar pattern in performance for both strategies due to the fact that both strategies have a long positions during this time. The divergence in portfolio performance mainly occurs during the period from 2022-02 until 2022-11. This is the moment where we short the JPM stock in the SMA strategy portfolio. As a result, the buy and hold strategy decreases in value because the share price decreases while the SMA strategy increases in value instead. From 2022-11 and onwards, both strategies have a long position and therefore follow a similar pattern again.
Hence, the SMA strategy performs the best thanks to its short position in 2022. But there are even more metrics that improve with our strategy. First, the Sharpe ratio improves which was 0.40 for the buy and hold and 0.74 for the SMA strategy. The Sharpe ratio measures the risk adjusted return of a stock. Ideally your ratio should be above one indicating that your earn excess return per unit of risk. While the Sharpe ratio is still below 1, an increase from 0.40 to 0.74 is still significant. Furthermore, the maximum downturn is also smaller for the SMA strategy. The maximum drawdown implies the drop from the peak of the portfolio to the bottom of the portfolio before you reach a new all time high. The max drawdown for the buy and hold strategy is -43.62% while for the SMA strategy it is only -28.53%. Indicating that the SMA strategy is less subjected to extreme losses.
Discussion
As the SMA strategy has shown, the performance is significantly better compared to the buy and hold strategy. However, it is important to discuss some of the practical aspects of trading on these signals. In this case study, the assumptions has been made that we do not pay any transactions fees and do not take into account the bid-ask spread. In reality, you have to take these factors into consideration as this will impact your costs and return. Hence, when you choose SMA’s with a shorter time period, this would imply more trading signals to act upon and therefore more transactions costs. Furthermore, market conditions also play a role when you have to select the time period for your SMA’s. When there is a lot of market uncertainty, it might be beneficial to choose shorter SMA’s to quickly react to rapid market changes and enter at more optimal trading points.
Conclusion
Trading JPM stock using the SMA crossover strategy can be a powerful strategy for those looking to capitalize on the up- and downward trends in a stock. Capturing downward trends would not be possible with a simple buy and hold strategy. Further, while the simplicity and effectiveness of SMA’s make them an appealing option for traders, it is important to consider them as part of a broader investment strategy. It is recommended to also look at other technical indicators and the fundamentals of a stock. Combining multiple strategies will help you make better price predictions and therefore, better investment decisions.
For investors that are eager to apply SMA strategies but have limited trading experience, it can be a good idea to start trading with a demo account as this will provide you with valuable practice without bearing any financial risk.
I/we have a position in an asset mentioned